API is an acronym for Application Programming Interface. It is a software intermediary that allows two applications to talk to each other. Put simply, a specialised handholding exercise where one system can either push or pull data, to or from another system.
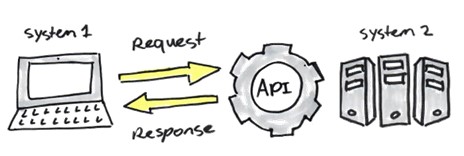
Commonly, they work by connecting cloud-based systems and transferring specific packets of data between programs. This allows farmers to choose a central dashboard and utilise the functionality of API to reduce the need to log into multiple interfaces.
Farmers have always relied on timely and accurate data to run their business. There are two key benefits to the development of the API:
1. Efficiency – Revolutionising access and movement of data.
Farm Management Software are transforming themselves into being the centralised dashboard for farmers. As it is the program used on regular basis, it makes sense to bolster its functionality from the vault for farm record into a central dashboard that facilitates the functionality of GIS, accounting, and various other applications from farm records.
For example, when you are sowing you can record the field, crop, variety, year, sowing rate, and date in the tractor. Integration can take the record of sowing “wheat in field 1”, duplicate the record in FMS, apply financial rules and populate an accounting record against a budget in separate accounting/financial software.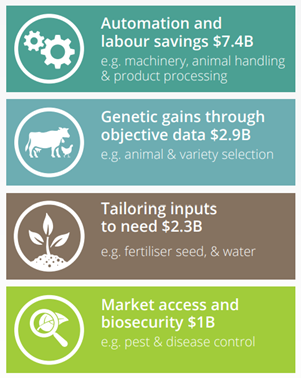
2. Productivity – Enabling analytics.
The analysis of digitally collected farm data will transform data analysis, modelling, and the provision of timely information for farmers. This will be achieved by coupling digitally collected farm data with existing, national and regionally collected data sets such as soils, environmental, and weather data. The Precision 2 Decision project, funded by all RDC’s conducted economic modelling on the impact to productivity for all Australian production sectors. It is projecting the gross value of agricultural (including forestry, and fisheries and aquaculture) production by $20.3 billion which represents a 25% increase on 2014-15 levels1.
Figure 1: Estimated potential Gross value of production (GVP) with decision agriculture.
Furthermore, there were four key opportunities where the productivity increases were most significant (see Figure 1). All opportunities rely on the use of digitally collected data and powerful analytics.
Author | Brooke Sauer, IntellectAg